


Before understanding forex indicators, we should know what an indicator is. The indicator is just a signal, clue or trend to follow something. In Forex market trading takes place by applying two kinds of analysis, Fundamental analysis and Technical analysis. Fundamental analysis is based on identifying the real value of a currency pair by comparing economic performance and future outlook of various countries. Technical analysis is applied by accumulating and analyzing historical forex data. For Technical analysis different kinds of tools or indicators are used to predict movement of currency pairs. Technical analysis is mostly used for short term currency movement. Different charts and indicators are used for different time frames like 1 minute, 5, minutes, 30, minutes, 1 hour, 1, day, 1 week, and 1 month etc. to predict trends for currency pairs.
- Moving Average- Moving average smoothens the price action. It is calculated by taking closing price over X number of periods. It creates a slope through which future price action can be predicted. If closing prices are taken for a longer period of time than it reacts slowly to price movement, however if closing prices are taken for a shorter period of time than it reacts quickly to price movement. There are two types of moving averages, simple moving average and exponential moving average.
- Simple Moving Average (SMA) – SMA is calculated by adding an X number of closing prices and then divide that number by X. Suppose you would like to create SMA for 10 periods for an hourly chart, it can be created by adding 10 hours and divide it by 10. Being a trader you don’t have to create it manually, you just have to put parameters of the period and trading platforms will automatically create it. It is always good to know how indicators are created so that you can change it as per your strategical requirement.
SMA doesn’t gives you true picture if there is a huge variance in prices due to some news or other major events. For Example- USD/JPY closing prices for last 5 days are as follows-
Day 1 -103.20
Day 2 -103.40
Day 3 ¬-103.10
Day 4 -103.50
Day 5 -103.10SMA = (103.20+103.40+103.10+103.50+103.10) / 5 = 103.26
What would happen to the moving average if in day 4 you get some news that can change the course of USD/JPY. Let’s see
Day 1 -103.20
Day 2 -103.40
Day 3 ¬-103.10
Day 4 -100.20
Day 5 -103.10SMA = (103.20+103.40+103.10+100.20+103.10) / 5 = 102.60
SMA shows that the prices were going down but it happened just because of one event or news on Day 4. The point is that SMA is too prone to one time events and news volatility, it will be useful if we can filter out these one time event volatilities. It is possible through Exponential Moving Average.
- Exponential Moving Average (EMA) – EMA overcomes these types of problems to a certain extent because EMA is calculated by considering recent periods. Suppose you want to calculate 10 period EMA and there is some news event on day 4 that can change the course of the currency pair but EMA consider the prices of recent days like 7, 8, 9, 10 so the event of day 4 doesn’t make much impact on it, as in the case of SMA.
- Bollinger Bands– Bollinger bands were developed by John Bollinger, it is used to check market volatility. It works on the principal of expanding and contraction of bands. When the band is expanded, it means market is highly volatile and when the band is in contract mode, it means volatility is very low. It works by providing mini support and resistance level. Bollinger band has two functions. Bollinger bands can be used as a strategy to trade when bands expand and squeeze. You can get lots of opportunity for trading in a week with expansion and contraction of the band
- Bollinger Bounce – It works on a range bound market and works on the notion that prices always tend to middle of Bollinger bands. You buy when prices hit lower band and sell when it hits higher band. It acts like dynamic support and resistance level. The longer the time frame the stronger the band will be.
- Bollinger Squeeze– It is used to get breakout signals, if the band squeezes then the market is quiet and in low volatility and breakout is going to happen sooner. If the candle stick breaks out above the top band then the price would continue to go up. If the candle stick breaks out below the lower band then the price would continue to go down.
- Stochastic – Stochastic is one of the most important indicators created by George Lane in 1950. It doesn’t gives you a price movement or volume movement on the chart but it provides you price momentum or speed.
How do Stochastic works?
Stochastic works by comparing present currency pair price to the currency price over a given time period. The more optimal setting for stochastic is to use 14 time period, it means if we take 4 hours chart then current price of currency will be compared with the price at 56 hours ago (14*4).It is composed of two factors/lines %K and %D. %K is the faster line and %D is the slower one.
%K (FAST LINE) = 100 X (Most recent closing prices – Lowest price of a 14 period) / (Highest price of a 14 period – Lowest price for a 14 period)
%D (SLOW LINE) = Simple Moving Average (SMA) of %K for a 3 period
The functionality behind stochastic is that when the prices are at upward trend then prices normally touch to high price and vice versa.
In order to develop your own strategy you can alter the parameter of indicator, if you reduce the %K period from 14 then indicator becomes faster and choppier. It becomes apt for faster reaction to changes in market condition and vice versa.
Use of Stochastic
Gaze Uptrend or Reversal: It is used to indicate when to enter and exit the market. It is based on overbought and oversold position calculation. It uses 0-100 scale to gaze the trend by using two moving average lines as mentioned above . When these two lines are above 80, it means the market is overbought and trends are going to reverse, it provides an opportunity to sell. When the two lines are below 20 means market is oversold and trends are going to reverse and provides an opportunity to buy. It can be used in all the time frames like 15 minutes, 30 minutes, 1 hour, 4 hour, 1 day etc.. However adjustment can be made to make it faster or slower as per your strategy.Divergence: If there is a divergence in stochastic and at the same time there is a divergence in prices then it indicates that there is a trend correlation or reversal. This in itself is not fully apt to give you true trend, you need to cross check it with some other indicators.
Crossing signal: Another way of trading with stochastic is to know the signal. When % K comes from above and crosses % D then we will have a sell signal and when % K comes from beneath and crosses % D then it should be a buy signal but stronger signal happens only when it crosses either at overbought position (80) or oversold position (20).
-
Parabolic SAR (stop and reversal) – Until now we saw indicators that only show starting trends. It is very important that you should know when the trend is going to start however along with starting trend if you also know when the trend is going to get over or a reversal is going to happen, it is like a double bonanza for trading forex. Parabolic SAR (stop and reversal) provides a signal for an exit strategy. Parabolic SAR was developed by Welles Wilder and can be used by placing Parabolic SAR dots, or points on your candlestick chart that Indicates potential reversals in price movement.
It is very useful when the market is highly bullish and bearish and carries long upside and downside. It is easy to use because it only provides bullish and bearish signal.
How to use Parabolic SAR – We use it for bullish and bearish trend so when dots are below the candlestick then it is a buy signal, when the dots are above the candlestick then it is a sell signal. It should not be used when the market is choppy.
- Relative Strength Index (RSI) – Just like stochastic, RSI is also a very useful indicator to confirm the trend. If you find that the trend is forming then wait for some time to see RSI movement. If RSI goes above 50 then it is a confirmation of uptrend and you can take your position. But in case RSI goes below 50 then there is a downturn. Like stochastic RSI also uses 0-100 scale to gaze entry and exit positions. RSI above 70 means the market is overbought and RSI below 30 means market is oversold.
- Average Directional Index (ADX) – Unlike stochastic or RSI ADX is an oscillator that does not indicate the trend being bullish or bearish. ADX shows the strength of the trend and if the trend is strong enough to sustain, it doesn’t matters whether it is a down trend or an up trend. Like stochastic and RSI, ADX also uses a scale between 0-100. When ADX is below 20 then the strength is very weak and the market is range bound, however when ADX starts increasing then there is a strong trend following, if ADX is more than 30 then there is quite a good strength, reaching 50 means there was a good rally. Normally it gets reversed after 50 and once it starts reversing it is a signal to book your profit.
ADX doesn’t provide you which way the trend is going; it just gives you the strength of the trend.How to use ADX?
ADX is one of the best indicators to use if it is properly combined with other indicators. As ADX doesn’t provide you trending direction, it is better you should first look at RSI and Stochastic for long or short positions and Moving Average for trending direction. If all these indicators provide you same trending direction then check it with ADX whether ADX is strengthening or not, if it is strengthening then you have a strong trend and you can take your position.
After rallying for some time if ADX starts reversing after 50-55 then you should close your trade and make profit. - Moving Average Convergence and Divergence (MACD) – MACD is another trending indicator that shows bullish and bearish trend however it is different from other indicators. It is developed by getting the difference between moving averages. MACD is calculated by considering three parameters –
Number period for calculating fast indicator
Number period for calculating slow indicator
Number period used to calculate the difference between faster and the slower moving averageNormally MACD uses 12, 26, 9 parameters, where 12 is used for 12 periods of fast moving average, 26 periods for the slower moving average, 9 differences between two moving averages.
MACD = 12-period Exponential Moving Average (EMA) minus the 26-period EMA
MACD single line = 9-period EMA of the MACD.
MACD Histogram = MACD minus the MACD Signal LineIn MACD there are parameters, first is MACD and second is a MACD single line and third a MACD Histogram to understand bullishness and the bearishness trend of the market.
How to trade with MACD?
As there are two moving averages with different speeds, faster one reacts quickly to market movements as compared to slower one. When faster moving average crosses the slower line and further diverges from it then it means that a new trend is forming.Downtrend Cross: When the fast line crosses and goes below the slow line and diverges further then it means that a downtrend is in progress. At a point, when the fast line crosses slower line, the histogram disappears because the difference between the lines at the time of the cross is 0. As the downturn begins and the fast line diverges away from the slower line, the histogram gets bigger, which is a good indication of a strong trend.
Uptrend cross:
When the fast line crosses over slow line and diverge further means uptrend is in progress. As the uptrend begins and the fast line diverges away from the slower line, the histogram gets bigger, which is a good indication of a strong trend.
The main drawback of MACD is that it lags behind in reacting to market price however some traders think it is good because it gives them full confirmation of the trend before taking any position to avoid losses.
There are different kinds of combination that can be made, however we are going to understand a few of them-
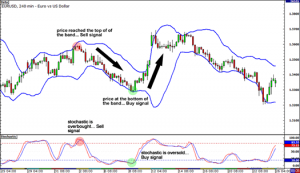
In the above EUR/USD example market seems to be range bound and moving sideways. We are going to see Bollinger Band and Stochastic that gives you buy/sell signal. As we see in the chart EUR/USD is climbing to top of the band which shows resistance level, at the same time Stochchastic red line is crossing blue line at over bought positions that show sell signal.
Both Bollinger bands and Stochastic confirm sell signal, you can take the position and make profit from it.
In the same chart we can see prices touching the lower band and it is showing that the bounce off is going to happen but we can’t just rely on Bollinger band however at the same time when we see the stochastic, where red line crosses the blue line from beneath at over sold position, it confirms that the market is oversold and there is clear buy signal for profit making opportunity.
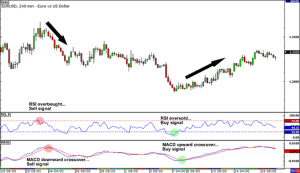
In the above chart we are using currency pair EUR/USD and RSI and MACD to gaze buy/sell signal. We understand that MACD is a delay indicator, it gives a signal a bit delay as compared to other signals, I believe it is a positive sign because it gives you a sure shot confirmation of trend. In the above chart as we see RSI @ over bought position and falling downward, it gives a sign to sell, after a few hours MACD blue line crosses over the red line and confirming the over bought position and sell signal. In another incidence RSI @ over bought position and still climbing shows a buy signal, after a few hours MACD blue line crosses beneath from red lines shows a buy signal and confirms that there is a sure shot buys sign.
Combining indicators confirm the trend and position taking opportunity. Best combination depends upon your choice.
I suggest you should use RSI, Stochastic, MACD, Parabolic SAR and ADX at the same time to gaze the trend formation and buy/sell signal.
Following are the preferable parameters of each indicator, however it is up to you to change it as per your requirement-
Bollinger Band ( 30,2,2) – Goes long when closing prices touch below the lower band and goes short when closing prices above higher band. It is used in different time frames however 1 day period is an ideal.
Moving Average Convergence and Divergence (MACD) (12,26.9)
Stochastic (14,3,3) -Goes long when %K crosses %D from below @ 20 (oversold) and goes short when %K crosses over %D @ 80 (overbought)
Parabolic SAR (.02,2) – Goes long when dots are below candlestick and goes short when dots are above candlestick.
Relative Strength Index (RSI) – Goes long when RSI crosses above 30 and goes short when RSI crosses below 70
Average Directional Index (ADX) – Goes long/short (takes a position) when ADX is strengthening above 20, close position when ADX starts declining from 50.
There are lots of other indicators however it is advisable to use indicators as per your suitability and understanding. No one indicator is sufficient in itself. Cross check the trend by using 2-3 indicators at a time and you will make your trade profitable.
Conclusion:
In this long and exhaustive session we learned lots of things like what is forex market, how to play in the forex market, who are the players to make or break, what are spreads, margin, liquidity and leverage, what are the fundamental of forex and how to make profit from the market? We understand the market volatility and importance of demo account. We realized not everybody can make money in the market and it is not that easy as we think, money can be made if you are dedicated and follow proper risk management and trading plan. We learned lots of indicators like MA, MACD, RSI, ADX etc., and the importance of each individual indicator to spot trends, breakout or buy/sell signal, we also learned that we can’t trade with one specific indicator, we need to use 2-3 indicators at the same time and cross check with each other for the confirmation of the trend and always use indicators as per your suitability and understanding.
Finally , we can say that there are a few drawbacks and heart breaking disadvantages of the forex market but the advantages always overshadow drawbacks and make it unique and best financial market to make money in a short time.