


Advance strategies is nothing but basic strategies plus some other advanced version of technical analysis. Before jumping into advance strategies you should make sure that you thoroughly practiced your basic strategy. Here we are going to see the advanced strategies only on the basis of technical analysis though we would consider some aspect of fundamental and sentiment analysis also but our core purpose is to understand advance strategies as per technical perspective, which is more used by retail traders.
Here we are going to see some advanced indicators or oscillators that identify entry and exit positions, speed or price action and duration of trends etc..
Before going further we should understand that there are two types of indicators that we follow in the forex market, first is leading indicators which are also called oscillators, leading indicators give signals before a new trend or reversal happens, the other is lagging indicators also called as trend following or momentum indicators, lagging indicators give signals once the trend has already started or if price changes are occuring.
There is always a merit and demerit of both types of indicators, leading indicators would give you more fake outs on the other hand if you use lagging indicators then you can be late and would miss the train of making money.
Advanced strategies are more about combining both leading and lagging indicators with each one complimenting the other. You should always cross check leading signal with lagging singles to reduce the chances of fake outs and make super profits on your each trade.
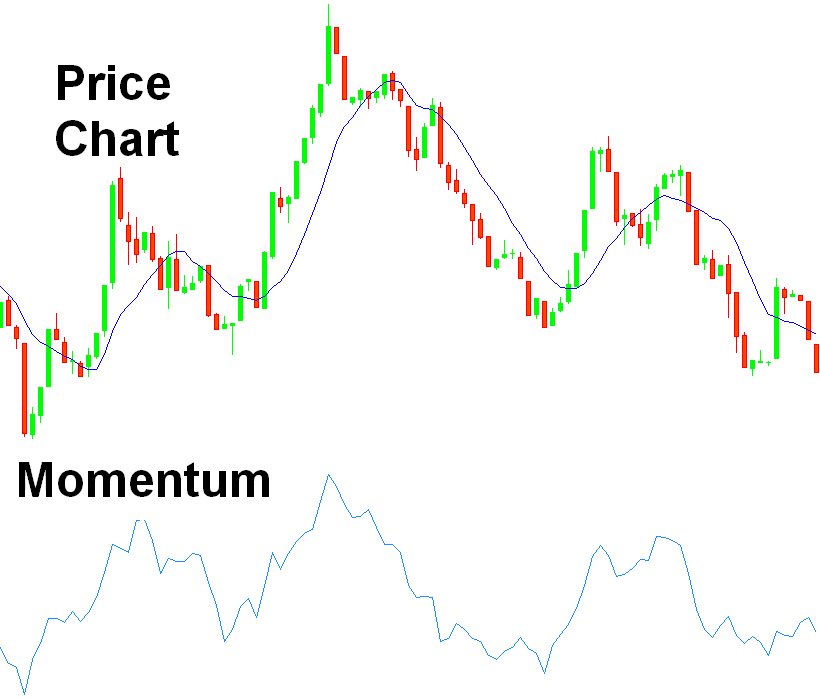
Momentum determines the strength or weakness of a trend as it progresses over time period.
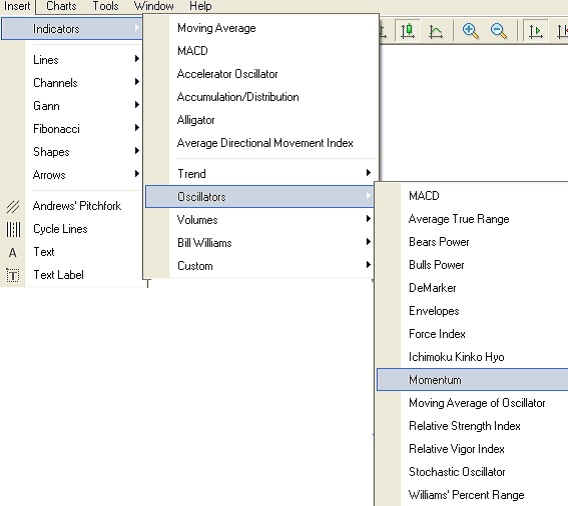
How to instal momentum on Meta 4.0
From top toolbar select Insert, Oscillators, Momentum
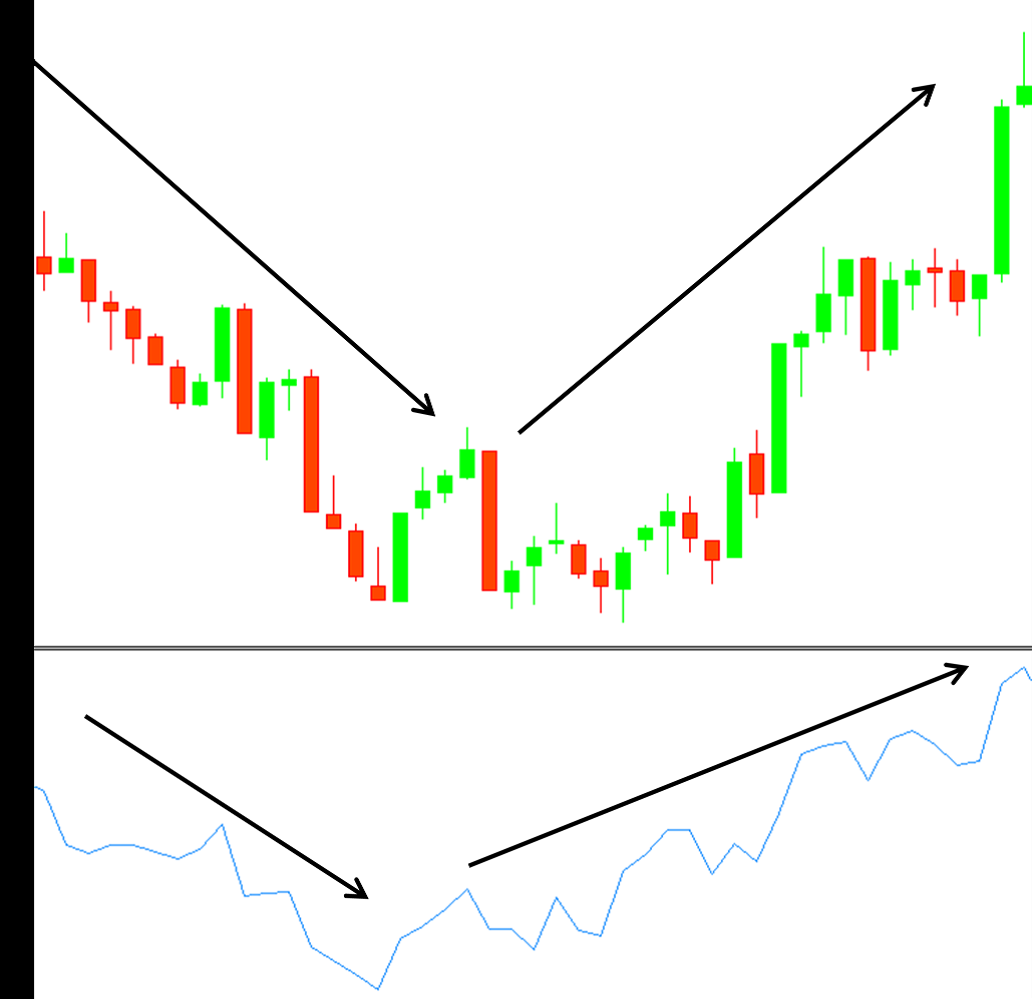
Generally momentum is very high at the start of the trend, it becomes very low at the time of reversal.
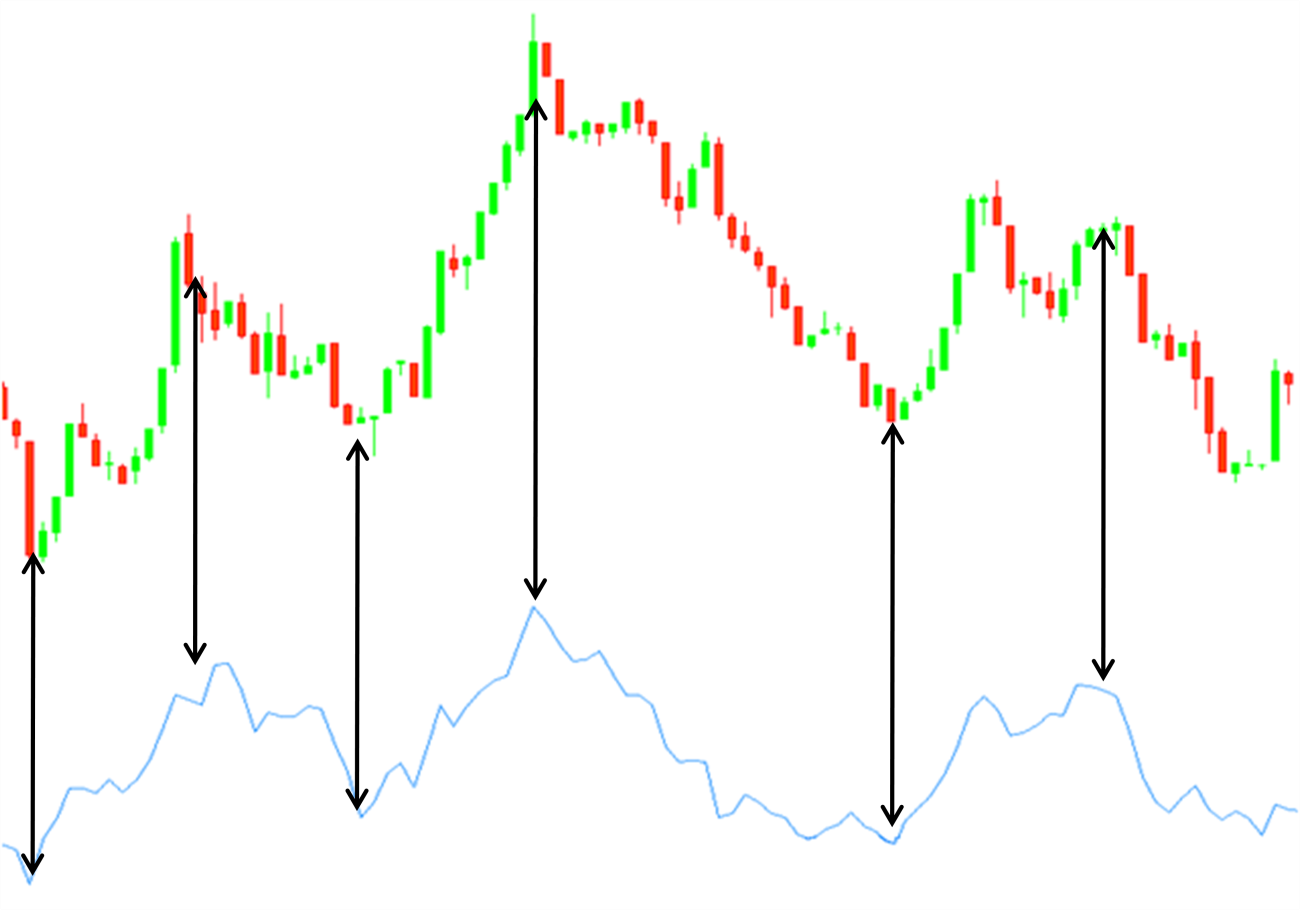
How to trade with momentum (Momentum Strategy)?
If you really want to make profit in the forex market then always stick to the momentum, BUY when the momentum is very high i.e. the market is bullish, SELL when the momentum is very low, at the time of reversal i.e. the market is bearish.
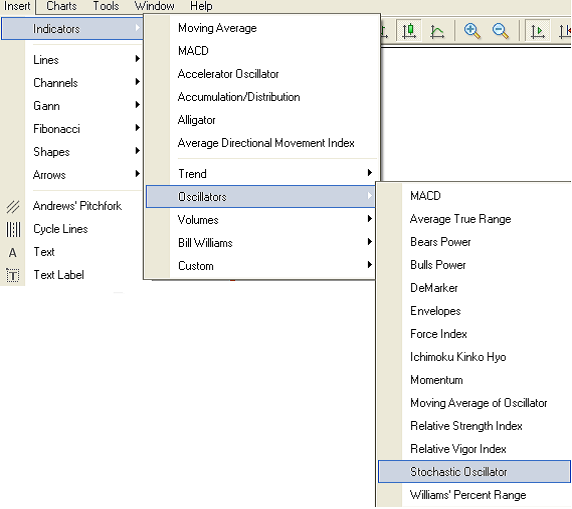
How to instal stochastic on Meta 4.0?
How to trade with Stochastic (Stochastic Strategy)?
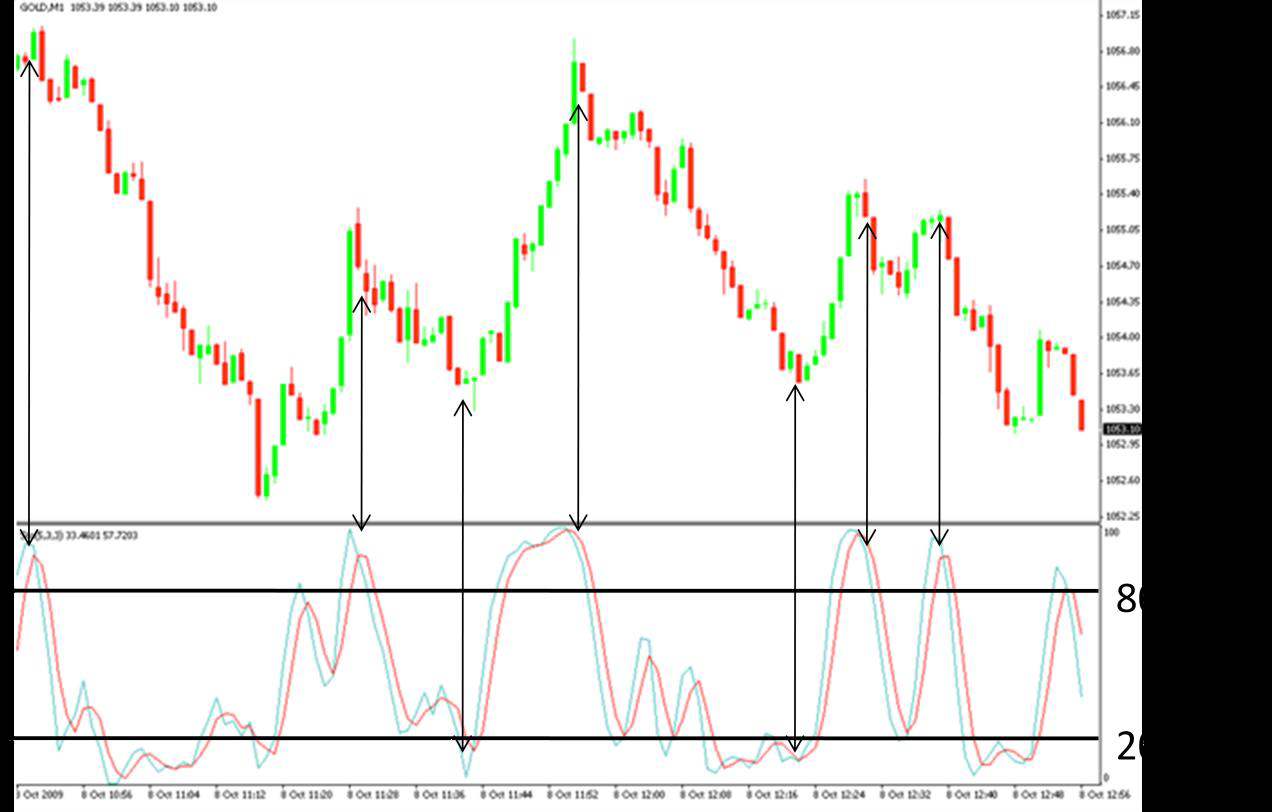
In the above image at first arrow, blue line (fast moving average) cross over the red line (slow moving average) above oversold position @ 80 means trend is reversing and it is a time to sell, price action also reveres during the same period.
In the third arrow the blue line comes from beneath and crosses the red line @ overbought position means the trend is reversing and it is a time to buy, price action also reverses during the same period. We can cross check each reversal with 4, 5 and 6 arrow and every time it matches with the price action.
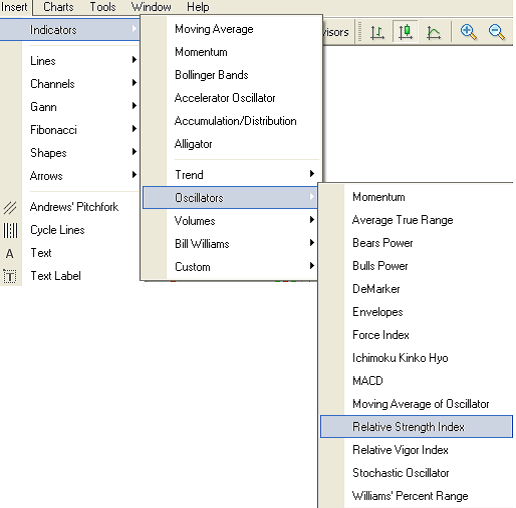
How to install RSI on Meta 4.0?
From the top toolbar select Insert, Indicators, Oscillators, RSI
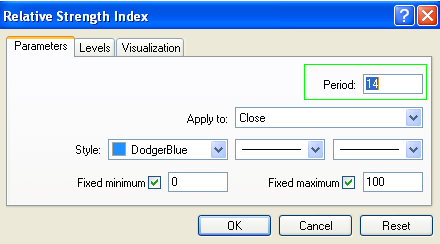
Volatility of RSI depends upon selection of period, the lesser the period more the volatile it will be, however the ideal period should be 14, here we have selected 14 periods.
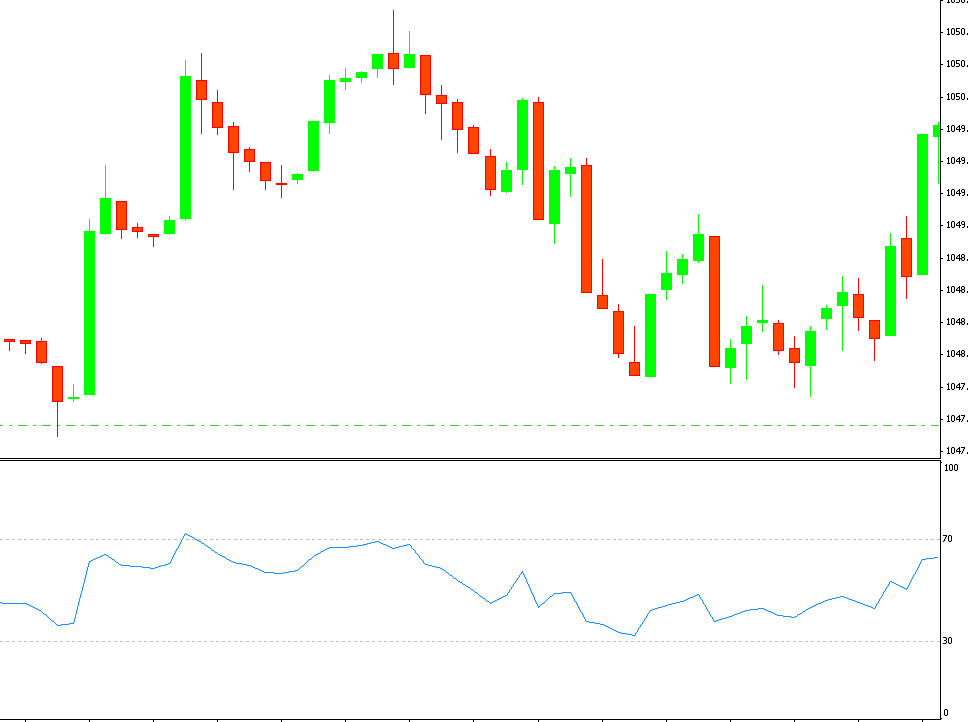
How to trade with RSI (RSI Strategy)?
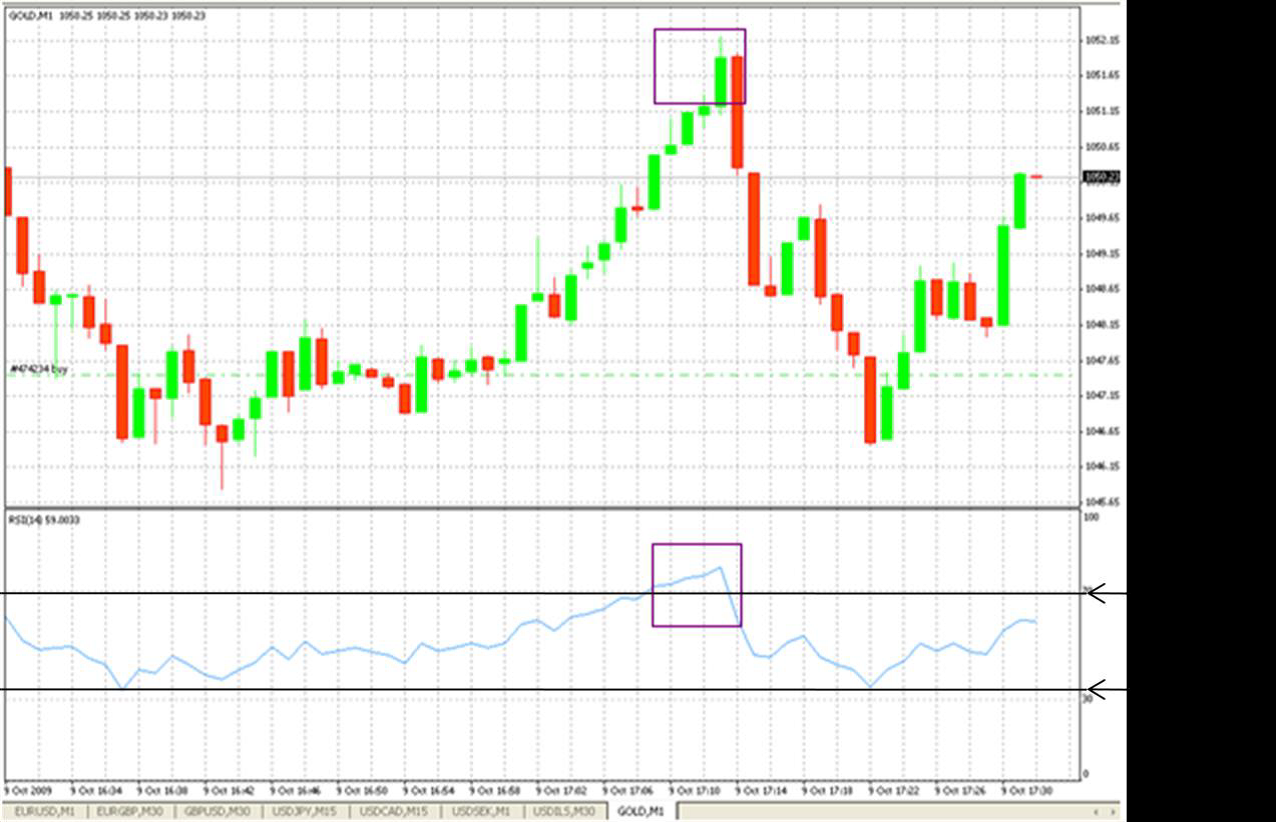
In the above image the square shows that RSI is @ overbought position (>70), it is a time to sell, price action on candlesticks also confirms the same as the market starts declining.
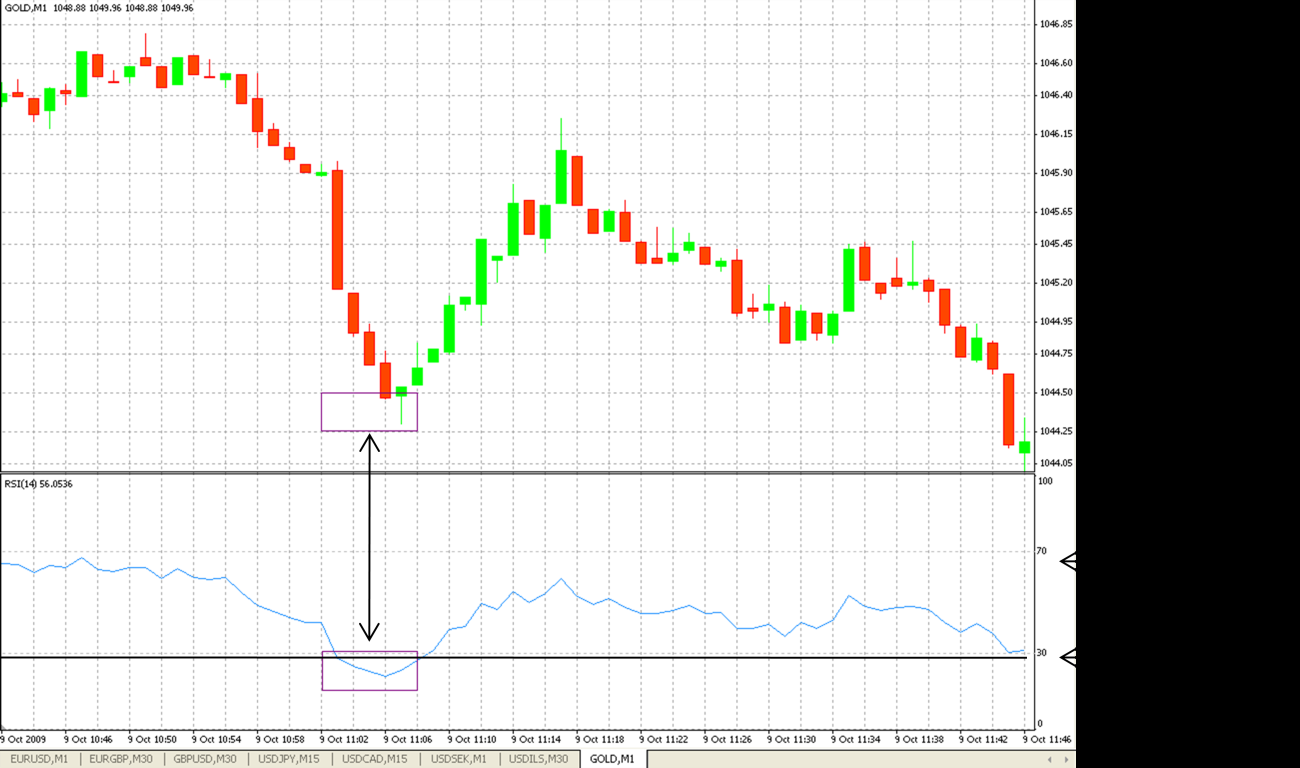
In the above image the rectangle shows that RSI is @ oversold position (<30), it is a time to buy, price actions on the candlestick chart also confirms the same as the market starts climbing from there on.
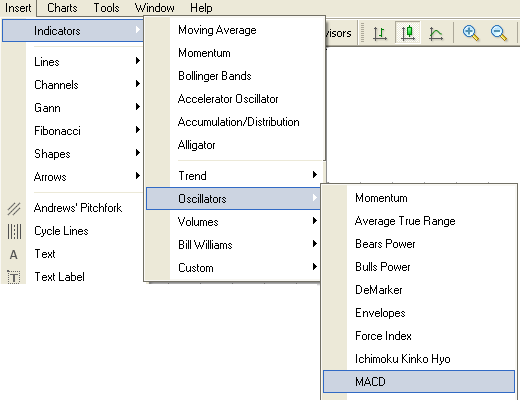
RSI provides both entry and exist positions along with the strength and weakness of a trend. If RSI is > 50 then the trend is strengthening & is bullish in nature, if RSI <50 and going downward means the market is bearish. [/accordion] [accordion title="Moving Average Convergence and Divergence (MACD)" ] MACD is another trending indicator that shows bullish & bearish trend however it is different from other indicators in the sense that it developed by taking the difference between moving averages. The MACD is a lagging indicator it gives signals after the reversal or price action. There are 3 methods which are used while trading with MACD- Crossover Divergence Dramatic Rise How to instal MACD on Meta 4.0?
From the top toolbar select Insert, Indicators, Oscillators, MACD
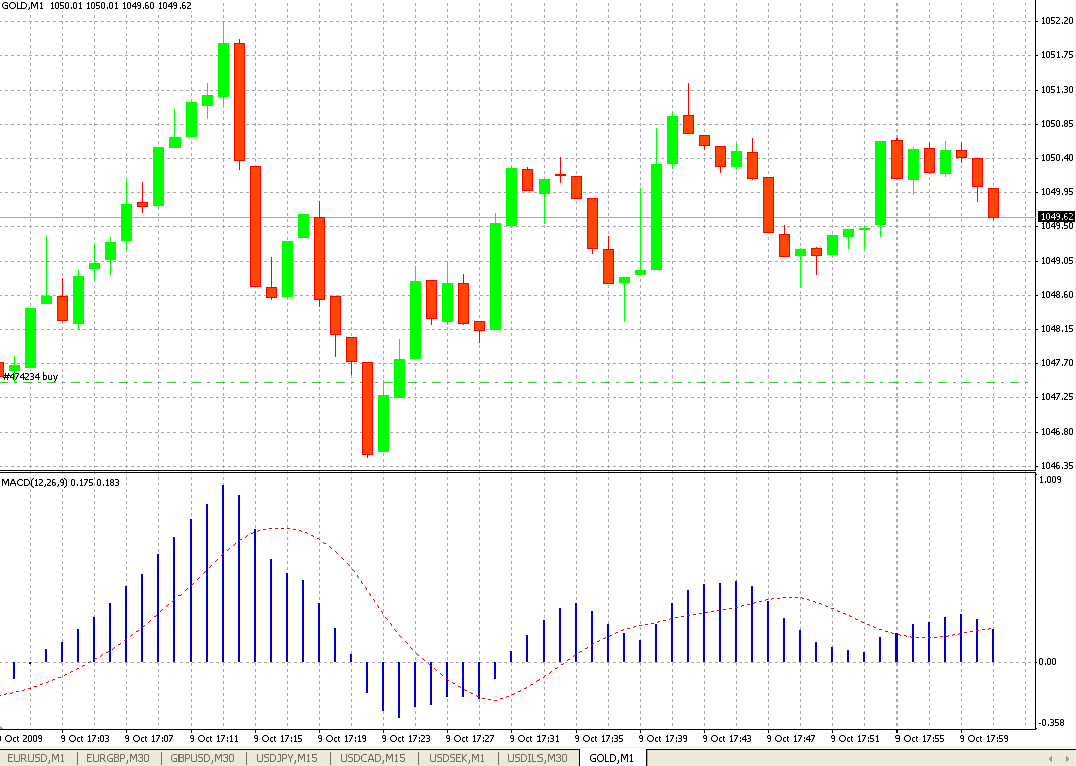
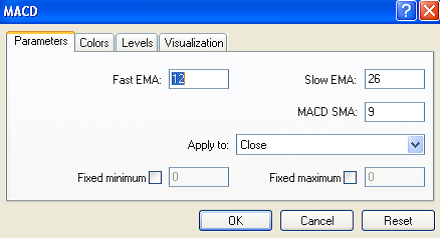
In the above mentioned image blue lines are the MACD Histogram, red line is a signal line. MACD is the difference between 12-period and 26-period EMA. The MACD signal line is 9-period EMA of the MACD, & MACD Histogram (blue line) is MACD minus the MACD Signal Line.
How to trade with MACD (MACD Strategy)?
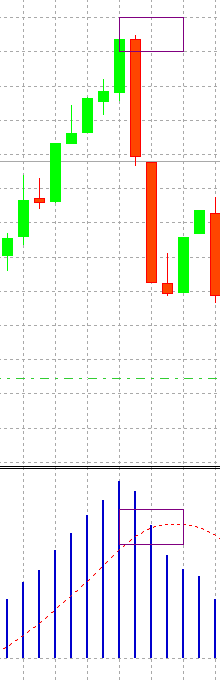
In the above image MACD HISTOGRAM starts falling below the MACD signal line in the selected rectangular area, it is a signal of bearish trend, sell and book profit. It is confirmed by price actions.
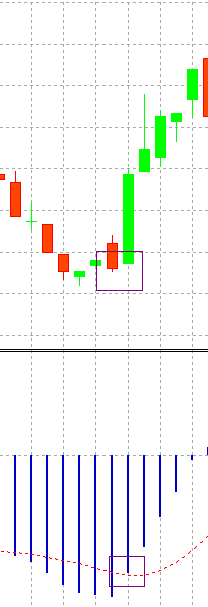
In the above mentioned image MACD HISTOGRAM rises above the MACD signal line in the selected rectangular area, it is a signal that prices are going upward and it’s time to buy. The same is confirmed by price action.
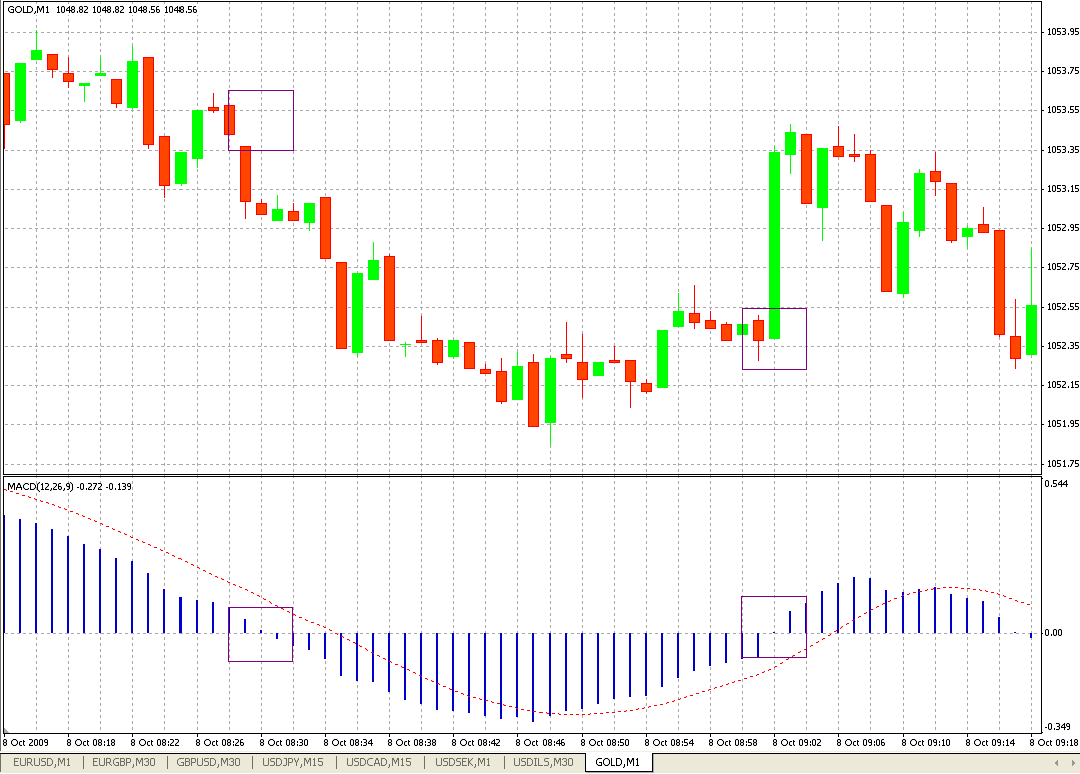
In the above image the MACD signal line crosses MACD HISTOGRAM down through & up through. Down through crossing at zero MACD HISTOGRAM (marked in square) shows bearish signal and the up through crossing at zero MACD HISTOGRAM (marked in square) shows bullish signal.
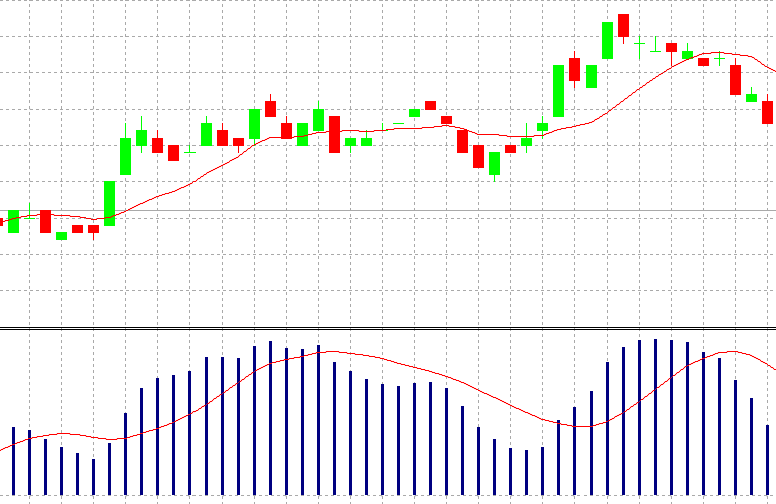
As mentioned in the above image when prices diverge from MACD HISTOGRAM then there is an end to the current trend.
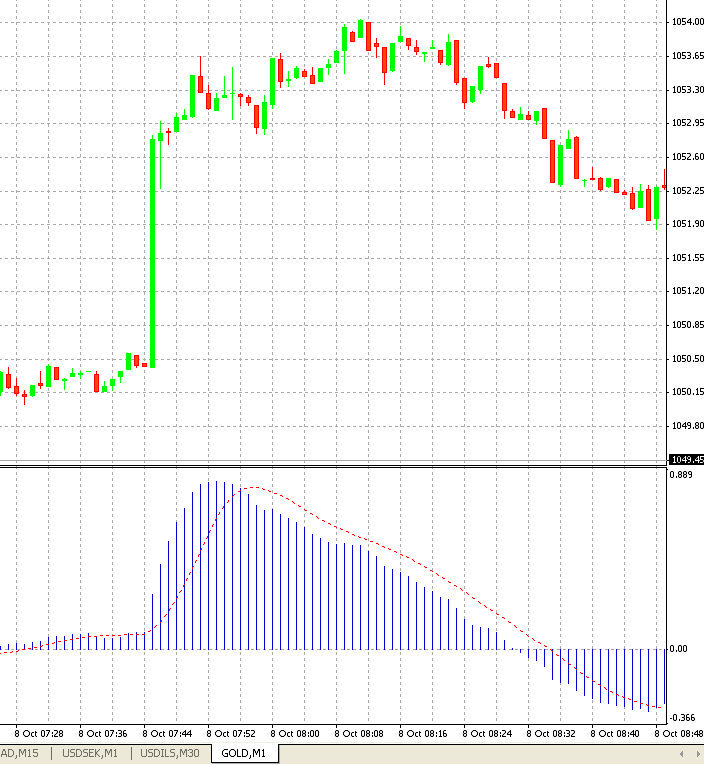
As mentioned in the above image MACD HISTOGRAM rises dramatically & it happens when the short term moving average pulls away from long term moving average, it signals that the currency pair is overbought and reversal would happen soon.
How to trade with ADX (ADX Strategy)
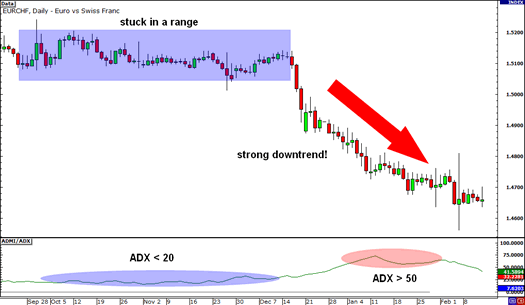
In the above mentioned chart highlighted in the blue shows that when ADX was hovering around 20, the market was moving sideways, once ADX started strengthening breakout happened and prices started falling, if ADX would have been followed then lots of money could have been made.
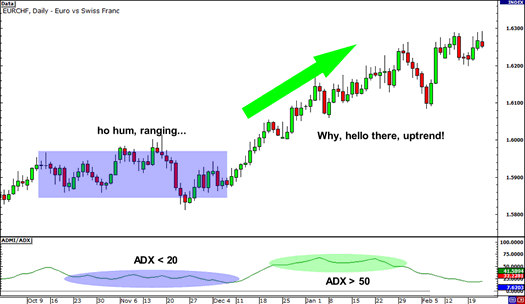
In the above mentioned chart, when ADX was hovering around in the 20s, the market was moving sideways however once ADX starts climbing, currency pair also started climbing and shows clear-cut uptrend, after 50 when ADX starts reversing, currency pair also started reversing.
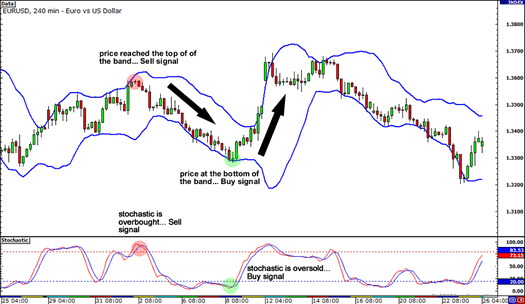
In the above EUR/USD example market seems to be range bound and moving sideways. We are going to see Bollinger Band & Stochastic that gives you buy/sell signal. As we see in the chart EUR/USD climbed to top of the band which shows resistance level, at the same time Stochchastic red line crosses blue line @ over bought positions that shows sell signal.
Both Bollinger bands & Stochastic confirm sell signal, you can take the position and make profit from it.
In the same chart as we see prices touched the lower band and it shows the bounce off is going to happen but we can’t just rely on Bollinger band however at the same time when we see the stochastic where the red line crosses the blue line from beneath @ over sold position confirms that market is oversold and there is clear buy signal for profit making opportunity.